
BUSINESS SERVICES
Your GTM Model is Built for a Business You No Longer Run
Why Single-Product Commercial Architecture Is Costing Business Services Organizations Their Best Deals, and What Your CMO and CRO Must Do Differently
The average business services deal has grown 25% year-over-year to $255,000. However, most business services commercial models are still designed to sell single services to single buyers through one relationship at a time.
The difference in how buyers want to purchase and how sellers are organized to sell is one of the most expensive inefficiencies in the business services commercial model today. This gap also sits squarely at the intersection of two executive mandates that are too often misaligned: the chief marketing officer’s (CMO) mandate to generate and prove demand and the chief revenue officer’s (CRO) mandate to convert and expand revenue.
Alexander Group’s 2026 Marketing Profitability & Commercial ROI Research, which surveyed more than 260 companies across eight industries, reveals that 80% of marketing organizations are now driving positive return on marketing investment (ROMI). Yet, 27% deliver returns of 2x or greater. The split between these two cohorts is commercial architecture, specifically how well the CMO and CRO have aligned their respective operating models around a shared growth plan.
Organizations that are delivering outsized returns have redesigned how they go to market by shifting from product-centric, single-line selling motions to integrated, solution-oriented commercial models that match business services buyer decision-making in 2026.
The rest are forgoing cross-sell and expansion revenue in every engagement.
Two Leaders, Two Operating Models, One Customer
Business services is not a monolith, and each subsector operates with different margin structures, buyer dynamics and coverage economics. For example, advisory services firms average $5.04 million in recognized revenue per organic seller with a 12.2% sales expense-to-revenue ratio. Corporate and managed services organizations achieve $7.04 million per organic seller at a leaner 7.7% sales expense ratio but carry a median 15.6% year-over-year (YoY) revenue growth rate.
Despite these differences, nearly all business services sectors share a common structural problem: Their CMO and CRO are optimizing different outcomes using disconnected operating systems.
The CMO is measured on pipeline contribution, brand awareness and marketing-attributed revenue. The CRO is measured on bookings, win rates and revenue per seller. Both are right—and both are incomplete. The customer doesn’t experience a firm’s marketing organization and your sales organization separately. They experience a single commercial engagement. When those two engines aren’t synchronized, the customer feels it in fragmented messaging, redundant outreach, disconnected handoffs and solutions that don’t match their actual buying intent.
We have six service lines, but our sellers still lead with whichever product they know best. Meanwhile, Marketing is running campaigns for each service line independently. The customer gets six different value propositions from the same company, and none of them tell a coherent story.
CMO, $2 billion-plus business services organization
My sellers are telling me they're not getting the right leads. Marketing is telling me they're generating record pipeline. Both things are true, because nobody agreed on what a 'qualified opportunity' looks like when it involves multiple service lines.
CRO, $1.4 billion professional services firm
The Buyer Has Moved, Both Leaders Must Follow
Business services clients now demand faster time-to-value, multi-line service delivery and tech-enabled solutions. Instead of purchasing piecemeal from specialists who don’t coordinate, business services leaders expect a single provider to solve interconnected problems like compliance and analytics; staffing and managed services; and advisory and implementation.
Critically, these leaders are doing their homework before either function ever gets a shot. According to Gartner, 75% of B2B buyers complete most of the early-stage evaluation without any vendor interaction. By the time a seller gets a discovery call, the buyer has already framed the problem, identified potential solutions and often shortlisted providers—based entirely on what they found through digital presence, thought leadership and peer recommendations.
What does this mean for each leader?
For CMOs
The demand engine has moved from just generating leads to now shaping the buyer’s perception of a firm’s solution breadth before any human interaction occurs. If the content, digital presence and campaign architecture are organized by product line instead of buyer problem, the market learns to see the organization as a single-service provider—even if there’s six service lines.
For CROs
Sellers are entering conversations where the buyer has already formed a point of view about what a firm can and can’t do. If the seller’s coverage model, enablement and comp plan don’t equip the seller to expand that perception, then the firm is competing for a fraction of the available wallet.
Why a Shared Architecture is the Solution
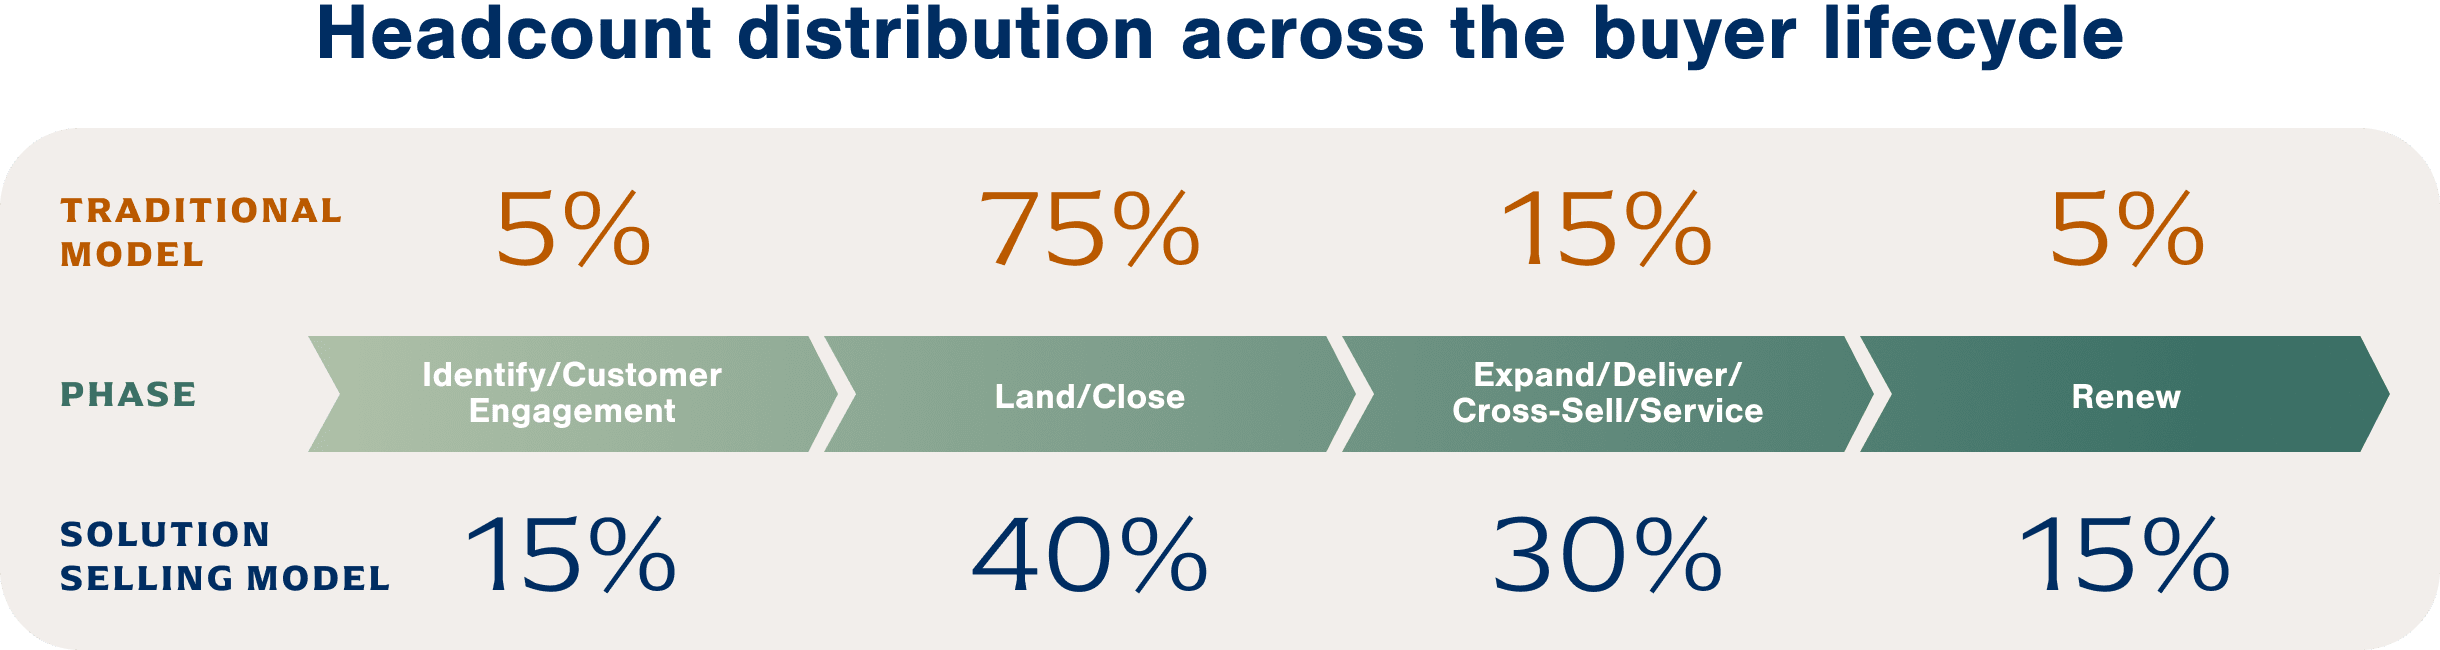
Alexander Group’s research on commercial excellence reveals an evolution in how high-performing organizations structure their commercial teams. Many are moving away from a traditional model, where 75% of headcount and cost are concentrated in the “persuade/close” phase. Instead, top performers are choosing to use a solution selling model that redistributes investment across the full customer lifecycle:
What does this redistribution mean for each leader?
The CMO's Shift
Marketing’s role expands from top-of-funnel lead generation (the 5% “Identify” phase) to a pervasive presence across the entire lifecycle. In the solution-selling model, Marketing owns 15% of the identify phase but also contributes meaningfully to expansion (through cross-sell campaigns, customer marketing and account-based marketing) and renewal (through loyalty programs, advocacy driven by net promoter score and retention marketing). Essentially, Marketing becomes a revenue function rather than a cost center.
The CRO's Shift
Sales capacity is redistributed from a 75% concentration on closing to a more balanced deployment across land (40%), expand (30%) and renew (15%). Coverage models must change to adapt to this redistribution: Specialists, customer success managers (CSMs) and expansion sellers will play larger roles, and compensation plans will reward the full lifecycle, not just new logo acquisition. Sales moves from a transaction engine to a solution orchestration function.
Alexander Group’s Business Services practice data shows what happens when both leaders make this shift together.
Neither function can deliver these gains alone. They require synchronized investment in demand intelligence (CMO) and coverage capacity (CRO).
>
0
%
higher average bookings from data science-enabled business services projects
$416,000 vs. $218,000
0
%
improvement in win rates, jumping from 45% to 63%
>
0
%
increase in anticipated bookings per opportunity
$264,000 vs. $97,000
What "Multi-Line" Actually Means in Each Subsector
The underlying principle is universal: Bundled, end-to-end solutions command larger deals, higher retention and better economics than single-service transactions.
Advisory & Professional Services
CMO Lens
The content strategy must position the firm as a platform, not a practice. Thought leadership should address interconnected buyer challenges (e.g., “How AI is reshaping both talent strategy and revenue operations”) instead of siloed expertise. And instead of individual service lines, campaign architecture should feature solution bundles.
CRO Lens
Sellers must be enabled to lead discovery conversations that surface needs across practices. Sales compensation must reward multi-practice deal construction, not just the practice the seller came from. Firms bundling advisory, analytics and implementation are capturing more than $255,000-plus average deal sizes, while those selling standalone projects are competing on price.
Tech-Enabled Corporate & Managed Services
CMO Lens
With median revenue growth of 15.6% and gross margins averaging 50%, the marketing investment case is strong. However, it still must be proven with ROMI rigor. Marketing should lead the narrative shift from “outsourcing provider” to “integrated operations platform” through executive-level content and ABM programs that target CFOs and COOs alongside CMOs and CROs.
CRO Lens
Coordinate coverage across solution specialists without creating a “coverage tax” that erodes margins. The sales expense-to-revenue ratio of 7.7% leaves little room for coverage bloat, so every specialist engagement must be ROI-justified.
HR & Staffing Services
CMO Lens
The traditional temp-staffing brand is a liability in the multi-line era. Marketing must lead repositioning efforts from transactional staffing to total workforce solutions. This can be achieved through industry-specific thought leadership, workforce analytics content and employer brand programs.
CRO Lens
Sellers trained to sell temp placements require different skills to sell managed staffing programs and workforce analytics. The coverage model must include solution architects who can translate client workforce challenges into multi-service proposals.
Data & Content Solutions
CMO Lens
Data providers evolving from single-dataset subscriptions to integrated analytics platforms need product marketing that articulates the platform value proposition. ABM campaigns should target the C-suite buying committee (CDO, CTO, CFO) that approves platform investments.
CRO Lens
The GTM challenge is figuring out how to sell a platform when your coverage model is organized by product line, and your sellers’ expertise is vertical. Our benchmarks show organic sellers per overlay specialist ratios averaging 6.7:1 in this cohort, indicating meaningful specialist investment.
Field-Based Services
CMO Lens
Marketing must bridge the gap between transactional service contracts (often sold locally) and strategic, multiyear platform deals (sold regionally or nationally). Digital marketing and local SEO are critical for transactional lead generation; ABM and executive events are critical for platform opportunities.
CRO Lens
Field sales models must support both motions simultaneously, which usually requires a bifurcated coverage model (local account managers for transactional business, regional solution sellers for platform opportunities) with clear escalation paths and shared credit mechanisms.
Our sellers know payments inside and out, but when the conversation shifts to loyalty programs or risk management, they freeze. Marketing generates demand for the platform, but the seller shows up and sells the product. We need the CRO's team to sell what the CMO's team is marketing.
CEO, mid-market FinTech
The Four Pillars of Adaptive GTM Architecture
Based on Alexander Group’s work with hundreds of business services organizations, the commercial model transformation rests on four pillars (strategy, structure, process and performance) with distinct CMO and CRO accountabilities within each:

Pillar 1
Strategy
Size the Prize and Define the Growth Plays
Shared Accountability: Both leaders co-own the strategic sizing of multi-line revenue opportunity by segment, by account and/or by buyer persona.
CMO-Led
- Market and buyer intelligence—using machine-learning (ML)-driven ideal customer profile (ICP) models, intent data and competitive intelligence to identify which accounts are most likely to buy multi-line solutions. Alexander Group's Data Science practice deploys next-best-offer (NBO) models that pinpoint value-add service expansion opportunities.
- Solution messaging architecture—developing cross-service value propositions organized by buyer problem (not product feature) that equip sellers to lead solution conversations.
- Demand center strategy—ensuring the demand generation engine targets multi-line buyers with coordinated campaigns rather than running independent campaigns per service line.
CRO-Led
- Account-level growth planning—mapping every account to a primary growth lever (Land, Adopt, Expand, Renew) and aligning seller assignments and coverage intensity accordingly.
- Needs-based segmentation that goes beyond firmographics—incorporating behavioral data, buying signals, and solution affinity to create actionable segments that drive differentiated coverage.
- Revenue growth objective alignment—ensuring quota structures and territory designs reflect multi-line opportunity, not just historical product-line revenue.
Key Finding
Organizations that invest in more than three ML commercial model use cases achieve over 4.3 percentage points higher YoY revenue growth compared to peers. Among data science leaders, 84% of data science leaders invest in ML to optimize seller productivity; 82% invest in ML to drive awareness and engagement.

Pillar 2
Structure
Deploy the Right Resources at the Right Time
CMO-Led
- Marketing organization design—55% of high-growth organizations are increasing headcount in marketing strategy, product management/marketing and lead generation. The CMO must staff for multi-line demand creation, which includes product marketers who own cross-service messaging and campaign managers who orchestrate multi-line ABM programs.
- SDR/BDR alignment—inbound SDRs should report to Marketing; outbound-focused BDRs should report to Sales. Demand generation headcount benchmarks show account-executive (AE)-to-SDR/BDR ratios of roughly 3:1 to 4:1, with SDR/BDR-to-manager ratios of about 5:1.
- Marketing-to-revenue integration—establishing shared pipeline targets and attribution models that connect marketing investment to revenue outcomes.
CRO-Led
- Hybrid coverage models—pairing generalist account managers (who own the relationship and orchestrate) with product/industry specialists (who bring deep expertise to complex deals). Business services benchmarks show organic sellers per overlay specialist ratios averaging 6.7:1 in the Data & Content Solutions cohort.
- Customer Success integration—with organic seller-to-CSM ratios averaging 5.6:1 in business services; the CSM role is a critical CRO lever for adoption, expansion and renewal.
- First-line manager span of control—business services benchmarks show 5.2–8.0 organic sellers per first-line manager (25th–75th percentile), with an average of 5.7.
When we restructured from six product-line sales teams to three solution-oriented pods, each with a lead seller, two specialists and a dedicated CSM, average deal size increased 34% in the first two quarters. But the CMO had to simultaneously restructure campaigns from product-line campaigns to solution campaigns. Neither change would have worked alone.
SVP Commercial Operations, $1.5 billion professional services firm

Pillar 3
Process
Align the Customer Engagement Model
CMO-Led
- Non-linear customer engagement—replacing the old linear model (Marketing → Sales → Service) with an integrated model where Marketing engages across every stage of the buyer journey, including post-sale expansion and renewal.
- Differentiated value propositions by segment and buyer persona—messages using business outcomes relevant to targeted buyers rather than product features.
- Campaign-to-revenue attribution—moving beyond marketing qualified lead (MQL) counting to marketing-attributed revenue measurements. Business services organizations allocate 3% of revenue to total marketing expense, generating 38% of pipeline from marketing.
CRO-Led
- Cross-functional sales plays—defining who leads, who supports and how credit is shared when opportunities span service lines. In Professional Services, this means separate practice areas (e.g., Tax, Advisory, and Technology) and functional teams (e.g., BD, Marketing, seller-doers, Engineering and Delivery work together to go to market with a “one-stop solution.”
- Rules of engagement (ROE)—clear, documented protocols for multi-line deal coordination that prevent territory conflicts and ensure the customer experiences a unified engagement.
- Solution-selling deal stages—pipeline management processes that track multi-line qualification, specialist engagement and cross-service discovery as distinct milestones.

Pillar 4
Performance
Measure What Matters
CMO Scorecard
- Marketing-attributed revenue and ROMI (80% of organizations report positive ROMI; 35% achieve 2x or higher)
- Pipeline contribution by marketing vs. sales-sourced (38% marketing-sourced)
- Campaign-to-opportunity conversion by channel (Top ROI channels: webinars, SEO and partner/affiliate)
- Multi-line campaign effectiveness (% of marketing-generated pipeline involving 2+ service lines)
- Speed-to-market (53% of high-growth organizations launch campaigns in less than one week)
- Brand equity and share of voice in target segments
CRO Scorecard
- Revenue per organic seller (business services range: $5.0 million to $7.0 million median by subsector)
- Win rate (business services with data science: 63% vs. 45% without)
- Average deal size: single-line vs. multi-line (target: 1.5x or more premium for multi-line)
- Cross-sell attach rate (% of accounts purchasing 2+ service lines)
- Sales expense-to-revenue ratio (business services range: 7.7–12.2% by subsector)
- Specialist utilization and overlay ROI
- Customer retention rate (business services benchmark: 89.4%)
- Compensation plan effectiveness (% of sellers at or above target; correlation between comp plan behavior and multi-line outcomes)
Shared Scorecard
- Total pipeline coverage ratio
- Customer lifetime value by engagement model
- Net revenue retention (multi-line accounts vs. single-line accounts)
- Solution deal qualification rate (% of pipeline more than $200,000 involving two or more service lines)
The single most important thing we did was create a shared scorecard between the CMO and CRO: one page, same metrics, reviewed weekly. It eliminated the finger-pointing about lead quality vs. follow-up speed and replaced it with a shared conversation about pipeline health and conversion.
CEO, $1.2 billion business services organization
CMO and CRO Budget Implications
The economics of multi-line commercial transformation are compelling, but they require coordinated investment from both leaders. Alexander Group’s 2026 Marketing Profitability & Commercial ROI Research reveals:
For the CMO
70% of companies expect to increase marketing budgets by 6% or more in 2026. And 35% expect increases exceeding 10%
High-growth organizations balance “people vs. program” spend. They avoid the trap of adding headcount without funding the campaigns those people will execute
Top performers use strong ROMI results to secure more budget. By doing this, they’re creating a virtuous cycle where proven returns unlock additional investment
Companies with efficient marketing organizations grow 2x faster
For the CRO
Sales expense-to-revenue optimization is the CRO’s primary efficiency lever; business services subsector benchmarks ranging from 7.7% to 12.2% indicate that there’s meaningful room to reallocate within the existing cost envelope
Coverage model redesign (specialist deployment, CSM integration, SDR alignment) can increase revenue per seller by 20 to 30% without proportional headcount increases
Compensation restructuring is the CRO’s most powerful behavioral lever because plans that reward multi-line outcomes shift seller behavior faster than any enablement program
Shared Investment Priority: Data Science Capabilities
With data science-enabled projects delivering 91% higher bookings and 42% higher win rates, the joint investment in predictive intelligence delivers returns to both the marketing pipeline (CMO) and the sales conversion engine (CRO).
The Multi-Line Solution Isn’t Optional for 2026
The buyers have moved, and the economics have shifted. Now, CMOs and CROs must ensure they’re operating from the same playbook instead of just optimizing in parallel for outcomes that don’t compound.
In Part 2, we’ll go deeper into the AI-powered coverage models and predictive growth intelligence that enable business services organizations to operationalize multi-line selling. We’ll also share distinct implementation roadmaps for the CMO (demand intelligence, channel optimization, attribution) and the CRO (coverage design, opportunity scoring, comp alignment).


More Resources