Although sales compensation designers may produce the perfect sales compensation plan, it may fail due to poor quota setting and poor attainment distribution.
Sales compensation quotas have a strong impact on sales representatives’ pay. Sales compensation plan designers must consider the sales organization’s ability to set proper companywide sales goals, and, more importantly, set quotas at the territory level. However, the process for setting and allocating quotas is typically separate and distinct from the compensation design team, HR and the plan’s administrator. Although sales compensation designers may produce the perfect sales compensation plan, it may fail due to poor quota setting and poor attainment distribution.
Sales organizations have a variety of methods for setting sales goals. (In this instance, goals are the larger companywide plan or forecast; they are typically a broad revenue measure. Quota refers to the individual sales representative sales objective.) This whitepaper addresses the sales performance data sets at an incumbent level, which guide the plan design process. The assessment uses quota attainment data from prior years. The basic assumption is that the sales organization’s ability to allocate quota remains the same moving forward. Although improvements enable greater normalcy of attainment curves, prior years’ performance influences decisions for sales compensation design. Companies should both align pay curves and improve sales quota setting processes for improved sales compensation plan effectiveness.
Sales compensation plan designers evaluate the goodness or normalcy of the attainment data. Figure 1 demonstrates good quota distribution. A healthy sales environment creates an appropriate balance of quota achievement, (i.e., a balance of those who meet and exceed their targets and those who do not). About two-thirds of the salespeople should meet or exceed quota; one-third should be below quota. This is a general objective and likely to fluctuate across the years. Regardless, sales compensation designers need to have a preferred distribution objective. The two-thirds (above quota) one-third (below quota) is the most common distribution preference.
Figure 1 (below), when compared to actual data, usually spurs discussion and some consternation. A company’s quota attainment scorecard is not the result of the sales compensation plan. It’s driven by effective quota allocation. Attainment data reflects a company’s understanding of the market potential. It also reflects the management’s belief on the difficulty for salespeople to achieve their individual quota.
Translating “Goodness” of Quota Scorecards
Once the designers establish general target attainment, the next step is to collect performance data of the sales team. It is important that the company segment the data to reflect potential differences in metrics, roles and crediting rules. Plan designers must collect at least three to four years of data. This is critical because examining fewer years, market abnormalities, as well as internal reorganization could skew results. Sales leaders are the first to discount the attainment data with comments such as: “Well, that was a bad year for our product”; “The economy was bad that year”; or “We reorganized that year.” Designers must stave off these objections to discrete bad years, by smoothing data and examining multiple years of data. The objective is to assess the sales management’s ability to set companywide goals and allocate quota amongst the salespeople.
Sales compensation plan designers need to react and iterate plan design to fit the company’s typical quota outcomes.
Segmenting Quota Attainment Data
Global aggregation of quota attainment data (see Figure 1) may not always be useful. Data may be too much of a roll-up for practical evaluation depending on the size of the company and number of incumbents. This data could reflect different regional differences in quota allocation processes, crediting rules and job roles. In many cases, different parts of the world have different market maturities, making the forecast of market potential very dissimilar to other more or less developed markets. Below is an attainment roll-up from a global technology company with approximately 1,200 incumbents and 10 prevalent job roles.
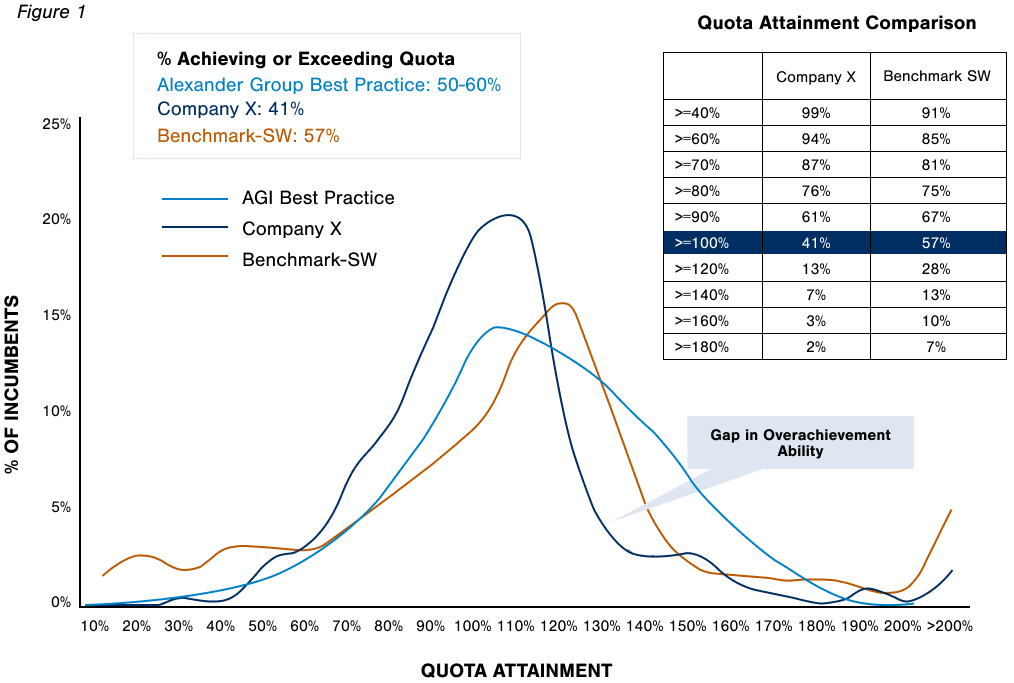
Although the majority of incumbents are below 100% attainment, this global roll-up of attainment data appears to have normal distribution attributes. A more desirable result would display two-thirds of salespeople above target. As shown in the regional view, attainments deteriorate more when the data is segregated on a geographic basis.
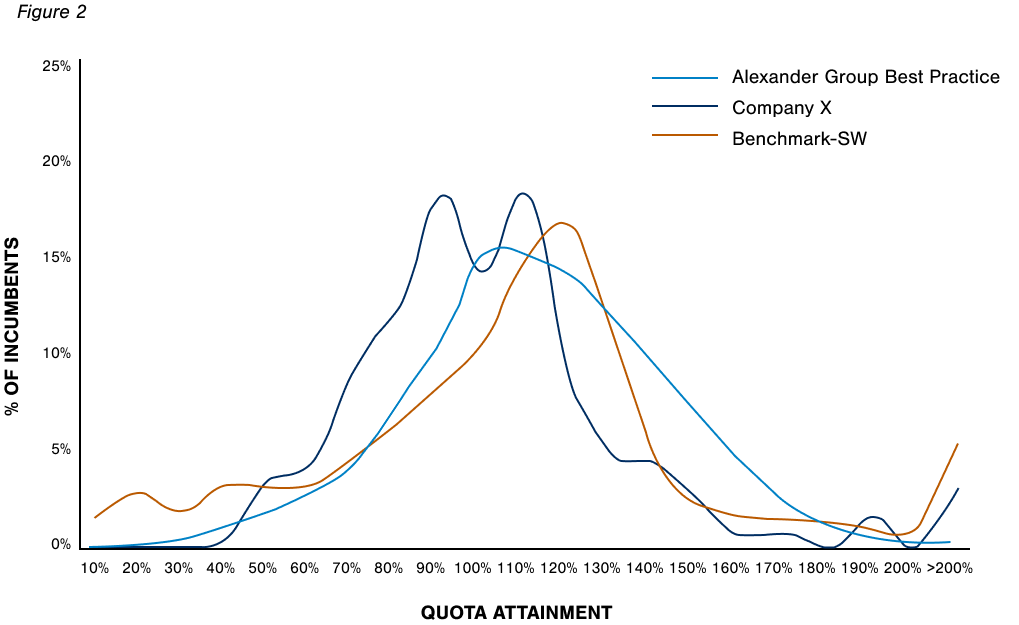
Geographic Region Analysis
Figure 2 is the first cut of a regional view. As the data filters down to the Americas region, the goodness of the normal distribution starts to diminish. This case indicates a slight bimodal profile on either side of 100% attainment. This indicates less than desirable outcome. Bimodal and trimodal outcomes are a common indication that the quota allocation is not fully effective. By examining the data further, it reveals that only 42% of the incumbents reached quota. This indicates the sales representative’s performance is well-off expectations—or quota burden is too high.
HR note: Notice that under performance by the sales organization may start to have the same significance as setting appropriate target total compensation (TTC) levels. Sales performance and the sales organization’s ability to meet goals and pay defined TTCs begin to impact recruitment and retention. Pay philosophies fall short when less than half of the representatives obtain TTC goals because of poor quota attainment.
Sales crediting also affects attainment distribution evaluations. One of the most common issues around crediting is large team- and country-based goals. For example, a country-based team of nine sellers in Poland (e.g., a district manager, sales representatives, a channel manager and a sales engineer might be on the same quota number). Large teams are often on regional numbers in Europe and in developing markets. If this type of crediting is present, it likely means there is less consistency across prior years. Companies use team-based goals on a regional basis, because individual quotas and country goals are not predictable. A common result of broad-based team quotas is that attainment trends toward 100%. This occurs with aggregation of customers and individuals not having to take risk with their particular customers. In these cases, commission plans with variable cost of sales may be more applicable for sales compensation.
Job Role Analysis
Another important segregation of attainment data is by job role. Attainments vary due to three main factors: the quota allocation process, the job role’s market segments and the smaller sample size reported for the role. For example, account managers or large account managers with fewer customers sometimes have larger standard deviations in their attainment distributions. These roles have a different quota setting process; one that closely analyzes customer buying potential. Typically, these roles use a bottom-up quota setting process that compels the representative to pick winners and losers in a more transparent manner. Account managers may have a wider spread of attainment and more normal distributions compared to other roles. This is a good result for compensation designers, because these data sets can be more predictable and consistent.
Sales Plan Design Considerations
Plan Measures. After multiple years of collecting, segmenting and graphing quota attainment data, the most important plan design decisions often revolve around measures. When analyzing previous quota attainment data, assume that the measures are correct; most often, they are. This usually included significant weighting of sales revenue, profitability or unit sales. Designers assume plan measures are correct, and forecasting errors are process- or market-driven in the attainment data analyses.
Major sales plan redesign efforts include long sessions discussing measures. This includes changing measures, adding measures and/or re-weighting measures. Strategic change via the marketplace, new products, product maturation and a host of other drivers are behind these major tactical sales plan redesigns. Designers can now make intelligent decisions about their core products or services and the introduction of new measures and reasonable weightings. The ability to forecast (and data sets will show only historical ability) should not be the overriding factor for plan measure selection. There should be a balance between the ability to forecast and the introduction of new measures and/or weightings.
Example: One of the most prevalent areas, especially in high-technology sales organizations, has been the rapid interest in professional services as a strategic growth area. Companies have rushed to provide significant incentives via the plans to salespeople to sell services. In some cases, overzealous sales leaders seeking a dramatic lift in services contracts will significantly increase the rewards for services revenue. However, not all sales forces are equipped to sell professional services. The transition from feature-and-price selling to solution selling may be arduous. Most complexities are outside of the sales plan details; for designers, quota attainment data and relative quota setting scorecard are an important input. Designers can now broach the issue of dramatic shifts in measures and weights given overall, regional and role forecasting. Conversations become more interesting if core product forecasting is below average as sales leaders attempt to shift a large portion of at-risk incentives to new initiatives. The messaging would read: “If you can’t forecast known revenue and products, how will you set goals and allocate quota for new services?” The learning for designers is practical balance with new measures. Calibrate the risk of demotivating the sales force because of inability to forecast the new measures.
Another prevalent measure is profitability. This measure assumes that the sales force can influence the contract price products and services. Designers can model historical profitability and have far greater confidence in quota attainment when transactional data is available. Introduction of a profit measure, from a quota attainment perspective, is typically not the primary issue. More importantly, there are other complexities associated with profit measures such as skill sets, approval levels and other issues not associated with forecast ability and attainment.
Pay Curve. Attainment distributions should align with payout curves and formulae. This enables designers to explore two main themes. First, compensation designers should be practical and realize the organization’s ability to forecast. Secondly, they should keep the payout curve simple and easy to understand.
Plan designers must be realistic about the ranges of achievements based on the company’s historical abilities of quota attainment. It is likely that the shape of the distribution (normalcy) and the clustering behind or ahead of 100% will not change dramatically if historical data shows such trends. Do not fine-tune and over engineer the pay curve to motivate salespeople into rarely achieving attainment. During the costing phase of plan design, incentive costs enable more insight into the positioning and slope of the payout curve.
Keeping the payout curve design simple supports the concept of simplicity for sales compensation plans. Formulae complexity results from unnecessary thresholds, too many changes of slope or inflection points and other differentiation between roles. Designers may find plans with up to six-plus inflection positioned below and above the 100% attainment point. This presents the opportunity to use the anchor of historical attainment distributions as a guide. It should be asked, “Do we need all of this complexity and change in incentive for our representatives if attainments are historically volatile?” A more simplistic formulae construction may be best. In most cases, keeping the payout tables simple drives the same “sell more, make more” philosophy as a complex curve with more than a half-dozen different inflection points.
Conclusion
Below are some general guidelines for using historical attainment data during the sales plan design process:
- Use multiple years, preferably three or four years, of historical data.
- Sort and segment the performance data and analyze by region, job role.
- Be practical and understand the sales organization’s ability to set companywide goals and allocate quota to regions and to territories.
- Understand implications of the goal-setting ability when implementing new measures, weights and for alignment with pay curves.
More Resources